library(psych)
fa.results <- fa(attitude,
                 nfactors = 2,
                 rotate = "varimax",
                 fm = "ml")
fa.diagram(fa.results, simple = FALSE)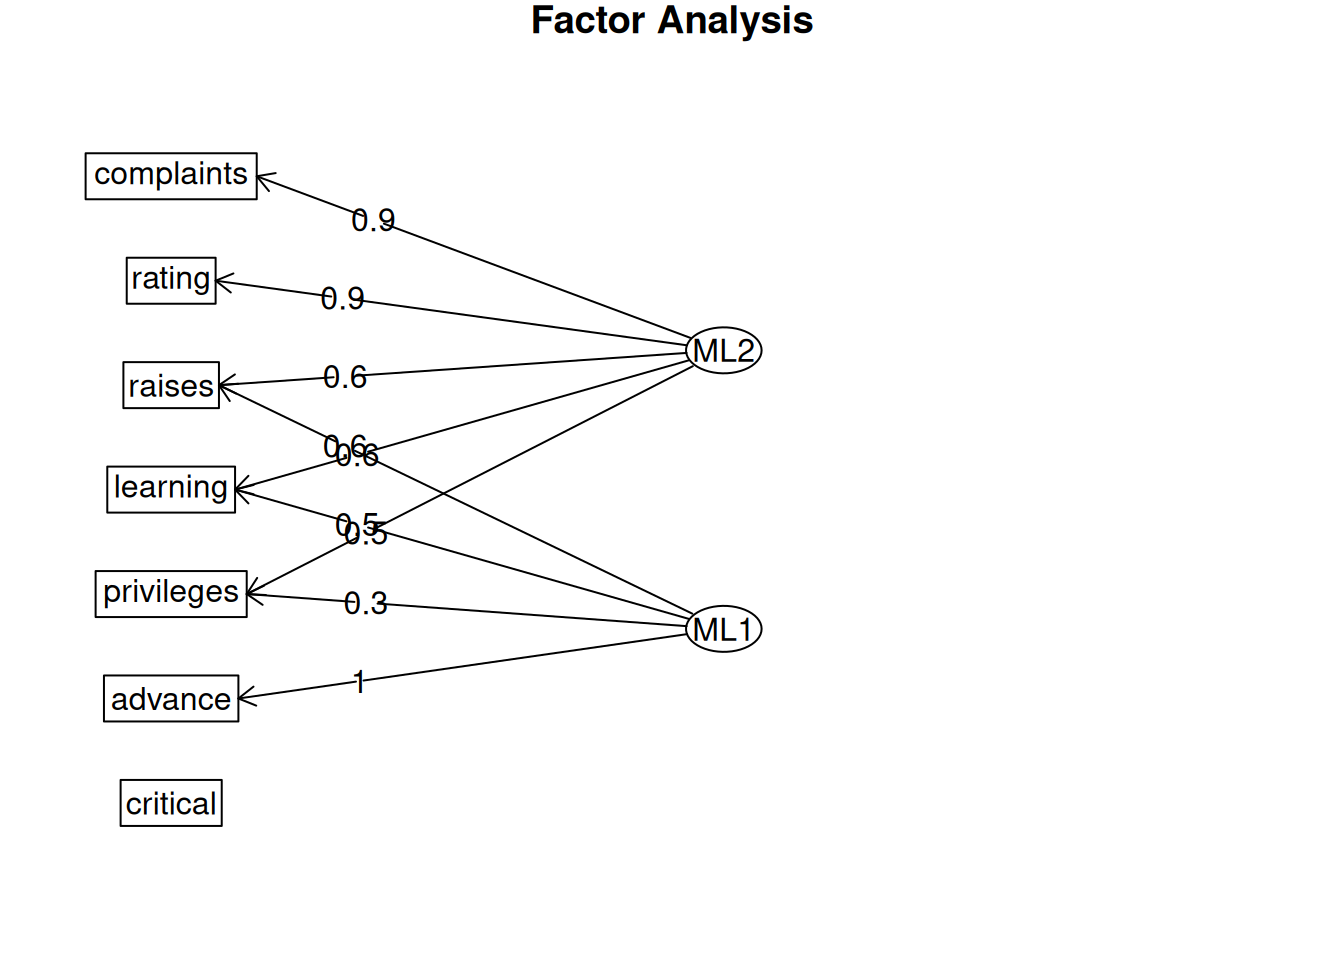
I’ve been playing around with making diagrams using Mermaid lately, and wanted to see if it was possible to easily export path diagrams for factor analysis models to Mermaid code. I thought that this could be useful as Mermaid can be used with Quarto, which I use for writing reports to clients.
Here’s an example of a exploratory factor analysis model using the attitudes data (taken from Section 10.1 of Modern Statistics with R):
library(psych)
fa.results <- fa(attitude,
nfactors = 2,
rotate = "varimax",
fm = "ml")
fa.diagram(fa.results, simple = FALSE)
This does the job, but isn’t pretty to look out (there are other functions for drawing path diagrams that can be used instead, but I’m sticking to the basics here).
The information needed to create the path diagram is stored in fa.results$loadings. Using this information, it is pretty straightforward to write the corresponding Mermaid code using some nested for-loops:
# Helper function:
names_to_letters <- function(names, name)
{
    LETTERS[which(names == name)]
}

# Main function:
fa.diagram_to_mermaid <- function(fa.results, file = "mermaid.txt", diagram_palette = NULL)
{
    factors <- fa.results$loadings
    all_names <- c(colnames(factors), row.names(factors))
    if(is.null(diagram_palette)) { diagram_palette <- palette.colors()[-1] }
    mermaid <- "%%{init: {'flowchart' : {'curve' : 'linear', 'nodeSpacing': 40, 'rankSpacing': 50}}}%%\nflowchart TD\n"

    # Create nodes and edges:
    for(j in 1:ncol(factors))
    {
        for(i in 1:nrow(factors))
        {
            this_column <- colnames(factors)[j]
            this_row <- row.names(factors)[i]
            mermaid <- paste0(mermaid, "    ", names_to_letters(all_names, this_column), "((", this_column, ")) ---->|", round(factors[i,j], 2), "| ", names_to_letters(all_names, this_row), "[", this_row, "]\n")
        }
    }

    # Add different colours to the different factors:
    k <- 0
    for(j in 1:ncol(factors))
    {
        this_column <- colnames(factors)[j]
        mermaid <- paste0(mermaid, "    style ", names_to_letters(all_names, this_column), " fill:", diagram_palette[j], "\n")
        for(i in 1:nrow(factors))
        {
            mermaid <- paste0(mermaid, "    linkStyle ", k, " stroke:", diagram_palette[j], "\n")
            k <- k + 1
        }

    }

    # Print the resulting Mermaid code:
    cat(mermaid)
    cat(mermaid, file = file)
}
The function prints the Mermaid code for the path diagram:
fa.diagram_to_mermaid(fa.results)%%{init: {'flowchart' : {'curve' : 'linear', 'nodeSpacing': 40, 'rankSpacing': 50}}}%%
flowchart TD
A((ML2)) ---->|0.88| C[rating]
A((ML2)) ---->|0.91| D[complaints]
A((ML2)) ---->|0.5| E[privileges]
A((ML2)) ---->|0.59| F[learning]
A((ML2)) ---->|0.61| G[raises]
A((ML2)) ---->|0.15| H[critical]
A((ML2)) ---->|0.05| I[advance]
B((ML1)) ---->|0.11| C[rating]
B((ML1)) ---->|0.18| D[complaints]
B((ML1)) ---->|0.32| E[privileges]
B((ML1)) ---->|0.51| F[learning]
B((ML1)) ---->|0.55| G[raises]
B((ML1)) ---->|0.28| H[critical]
B((ML1)) ---->|0.98| I[advance]
style A fill:#E69F00
linkStyle 0 stroke:#E69F00
linkStyle 1 stroke:#E69F00
linkStyle 2 stroke:#E69F00
linkStyle 3 stroke:#E69F00
linkStyle 4 stroke:#E69F00
linkStyle 5 stroke:#E69F00
linkStyle 6 stroke:#E69F00
style B fill:#56B4E9
linkStyle 7 stroke:#56B4E9
linkStyle 8 stroke:#56B4E9
linkStyle 9 stroke:#56B4E9
linkStyle 10 stroke:#56B4E9
linkStyle 11 stroke:#56B4E9
linkStyle 12 stroke:#56B4E9
linkStyle 13 stroke:#56B4E9When rendered in a mermaid block in Quarto, the diagram looks like this:
%%{init: {'flowchart' : {'curve' : 'linear', 'nodeSpacing': 40, 'rankSpacing': 50}}}%%
flowchart TD
    A((ML2)) ---->|0.88| C[rating]
    A((ML2)) ---->|0.91| D[complaints]
    A((ML2)) ---->|0.5| E[privileges]
    A((ML2)) ---->|0.59| F[learning]
    A((ML2)) ---->|0.61| G[raises]
    A((ML2)) ---->|0.15| H[critical]
    A((ML2)) ---->|0.05| I[advance]
    B((ML1)) ---->|0.11| C[rating]
    B((ML1)) ---->|0.18| D[complaints]
    B((ML1)) ---->|0.32| E[privileges]
    B((ML1)) ---->|0.51| F[learning]
    B((ML1)) ---->|0.55| G[raises]
    B((ML1)) ---->|0.28| H[critical]
    B((ML1)) ---->|0.98| I[advance]
    style A fill:#E69F00
    linkStyle 0 stroke:#E69F00
    linkStyle 1 stroke:#E69F00
    linkStyle 2 stroke:#E69F00
    linkStyle 3 stroke:#E69F00
    linkStyle 4 stroke:#E69F00
    linkStyle 5 stroke:#E69F00
    linkStyle 6 stroke:#E69F00
    style B fill:#56B4E9
    linkStyle 7 stroke:#56B4E9
    linkStyle 8 stroke:#56B4E9
    linkStyle 9 stroke:#56B4E9
    linkStyle 10 stroke:#56B4E9
    linkStyle 11 stroke:#56B4E9
    linkStyle 12 stroke:#56B4E9
    linkStyle 13 stroke:#56B4E9
It is possible to change the palette by providing a vector of colour HEX codes:
fa.diagram_to_mermaid(fa.results,
                    diagram_palette = c("#ff9f00", "#8b4ee1"),
                    file = "mermaid2.txt")
%%{init: {'flowchart' : {'curve' : 'linear', 'nodeSpacing': 40, 'rankSpacing': 50}}}%%
flowchart TD
A((ML2)) ---->|0.88| C[rating]
A((ML2)) ---->|0.91| D[complaints]
A((ML2)) ---->|0.5| E[privileges]
A((ML2)) ---->|0.59| F[learning]
A((ML2)) ---->|0.61| G[raises]
A((ML2)) ---->|0.15| H[critical]
A((ML2)) ---->|0.05| I[advance]
B((ML1)) ---->|0.11| C[rating]
B((ML1)) ---->|0.18| D[complaints]
B((ML1)) ---->|0.32| E[privileges]
B((ML1)) ---->|0.51| F[learning]
B((ML1)) ---->|0.55| G[raises]
B((ML1)) ---->|0.28| H[critical]
B((ML1)) ---->|0.98| I[advance]
style A fill:#ff9f00
linkStyle 0 stroke:#ff9f00
linkStyle 1 stroke:#ff9f00
linkStyle 2 stroke:#ff9f00
linkStyle 3 stroke:#ff9f00
linkStyle 4 stroke:#ff9f00
linkStyle 5 stroke:#ff9f00
linkStyle 6 stroke:#ff9f00
style B fill:#8b4ee1
linkStyle 7 stroke:#8b4ee1
linkStyle 8 stroke:#8b4ee1
linkStyle 9 stroke:#8b4ee1
linkStyle 10 stroke:#8b4ee1
linkStyle 11 stroke:#8b4ee1
linkStyle 12 stroke:#8b4ee1
linkStyle 13 stroke:#8b4ee1%%{init: {'flowchart' : {'curve' : 'linear', 'nodeSpacing': 40, 'rankSpacing': 50}}}%%
flowchart TD
A((ML2)) ---->|0.88| C[rating]
A((ML2)) ---->|0.91| D[complaints]
A((ML2)) ---->|0.5| E[privileges]
A((ML2)) ---->|0.59| F[learning]
A((ML2)) ---->|0.61| G[raises]
A((ML2)) ---->|0.15| H[critical]
A((ML2)) ---->|0.05| I[advance]
B((ML1)) ---->|0.11| C[rating]
B((ML1)) ---->|0.18| D[complaints]
B((ML1)) ---->|0.32| E[privileges]
B((ML1)) ---->|0.51| F[learning]
B((ML1)) ---->|0.55| G[raises]
B((ML1)) ---->|0.28| H[critical]
B((ML1)) ---->|0.98| I[advance]
style A fill:#ff9f00
linkStyle 0 stroke:#ff9f00
linkStyle 1 stroke:#ff9f00
linkStyle 2 stroke:#ff9f00
linkStyle 3 stroke:#ff9f00
linkStyle 4 stroke:#ff9f00
linkStyle 5 stroke:#ff9f00
linkStyle 6 stroke:#ff9f00
style B fill:#8b4ee1
linkStyle 7 stroke:#8b4ee1
linkStyle 8 stroke:#8b4ee1
linkStyle 9 stroke:#8b4ee1
linkStyle 10 stroke:#8b4ee1
linkStyle 11 stroke:#8b4ee1
linkStyle 12 stroke:#8b4ee1
linkStyle 13 stroke:#8b4ee1
I’m not really pleased with the lines here (I’d like them to be either linear or smooth curved lines), but haven’t found a setting in Mermaid that I like better than the one used above.
Another option is to use fa.graph from {psych} to export a Graphviz dot file with the diagram.
fa.graph(fa.results, simple = FALSE, out.file = "graph.dot")This can also be used in Quarto, with a dot block and the resulting Graphviz code:
digraph Factor  {
  rankdir=RL;
  size="8,6";
  node [fontname="Helvetica" fontsize=14 shape=box, width=2];
  edge [fontname="Helvetica" fontsize=10];
V1  [label = "rating"];
V2  [label = "complaints"];
V3  [label = "privileges"];
V4  [label = "learning"];
V5  [label = "raises"];
V6  [label = "critical"];
V7  [label = "advance"];
node [shape=ellipse, width ="1"];
ML2-> V1 [ label = 0.9 ];
ML2-> V2 [ label = 0.9 ];
ML2-> V3 [ label = 0.5 ];
ML2-> V4 [ label = 0.6 ];
ML2-> V5 [ label = 0.6 ];
ML1-> V3 [ label = 0.3 ];
ML1-> V4 [ label = 0.5 ];
ML1-> V5 [ label = 0.6 ];
ML1-> V7 [ label = 1 ];
{ rank=same;
V1;V2;V3;V4;V5;V6;V7;}{ rank=same;
ML2;ML1;}}The lines look much better here, but I’m still not entirely pleased with the result. It may well be the best of the three though. Graphviz with some additional customisation may be the way to go, even though I usually prefer Mermaid.